• Skip to main content
  • Skip to primary sidebar

This view of service management...

On the origin and the descent of managing services. We put meat on the bones.

  • Kanban eLearning
  • Services
    • Kanban Software Solutions
    • Consulting & Coaching
    • Training & Seminars
  • Posts
  • Events
    • Events – Agenda View
    • Events – Calendar View
    • International Service Management Calendar
  • Publications
    • Our Publications
    • Notable Publications
    • Quotes
  • About us

The Three Indicators

28 September 2020 by Robert Falkowitz Leave a Comment

Using the Kanban method leads us to rethink the indicators of performance and work manage­ment. Traditionally, we speak of lead indicators and lag indicators. But neither of these do justice to the essential benefit of Kanban allowing teams to im­prove how they work while they do the work. Thus, it is useful to speak of a third type of indicator: the along indicator.1

Suppose you are racing down a road in your car and come to an unexpectedly sharp bend. There is danger that you might not safely negotiate the curve.

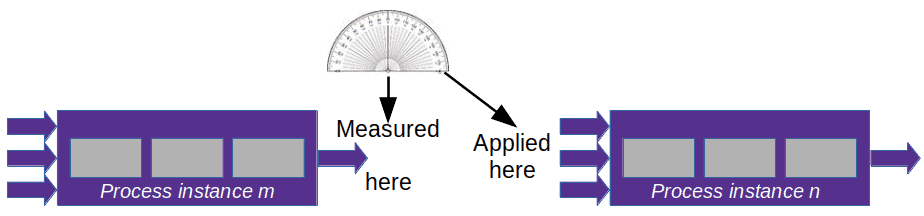
Lead indicator: When you get into the car, your passenger says you should not drive too fast. You risk not being able to react in time to unpredictable conditions in the road. But, since your passenger is always nagging you about your driving, you may or may not pay attention.

speedometer
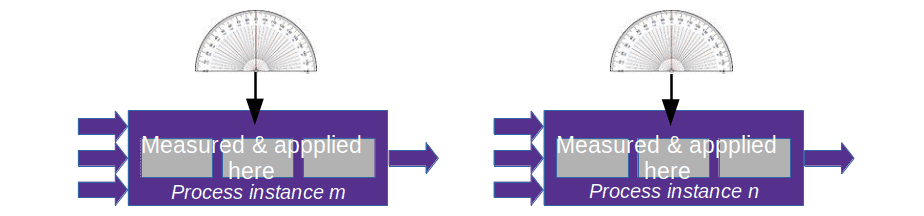
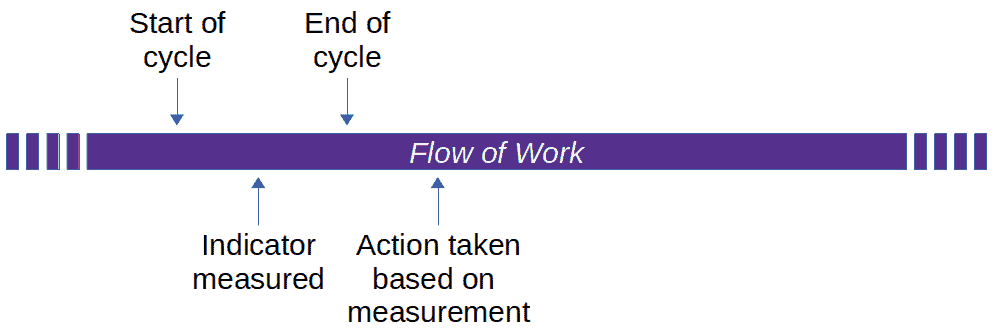
Along indicator: While you enter the curve, your passenger shouts “Slow down!”. If your reaction time is sufficient and the road is not too slippery, you brake enough to safely negotiate the bend.

dangerous curve ahead sign
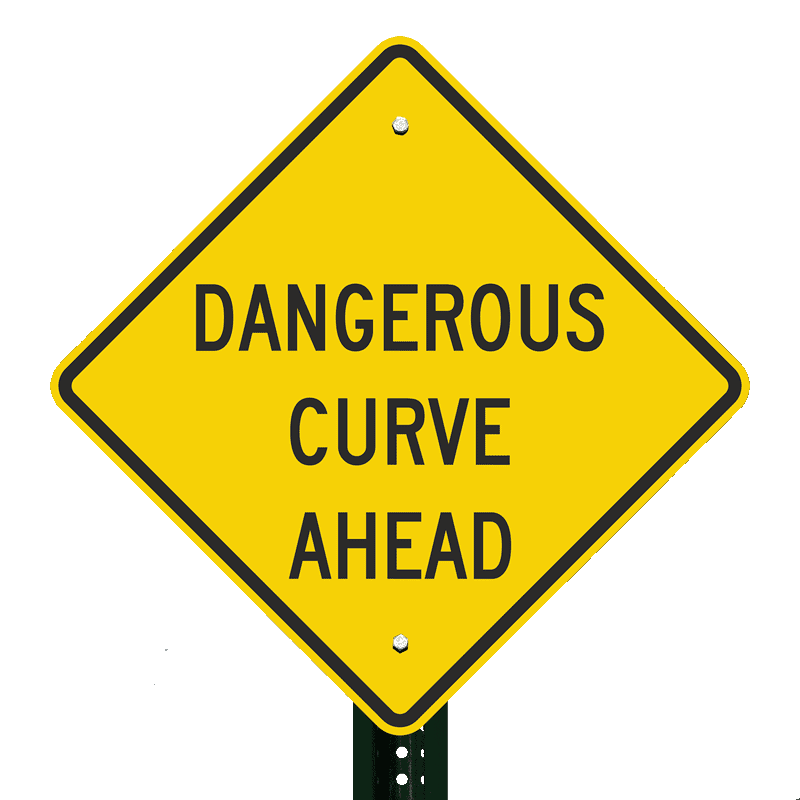
Lag indicator: The police report about yet another fa­tal accident at that bend concluded that the car was going too fast. As a result, they had a large sign erected near the start of the bend saying “DANGEROUS CURVE AHEAD. SLOW DOWN!” Alas, that sign will bring neither the driver nor the passenger back to life.

The usefulness of  the along in­di­ca­tor may be brought into re­lief by looking first at in­di­ca­tors used in the scrum method. Consider the sprint during which the team executes its value stream (or process) multiple times. Lead in­di­ca­tors are measured before the start of a sprint. Lag in­di­ca­tors are measured after the end of a sprint. As we shall see, I think it useful to speak of three indicators: lead, lag, along.

Lead Indicators

Fig. 1: The lead indicator is measured before a process is executed and applied to one or more future process instances

The story points asso­ci­ated with user stories exemplifies the lead indicator. Es­ti­mat­ing story points provides an in­di­ca­tor of how much work should be planned for a sprint. On the other hand, velocity might exemplify a lag in­di­ca­tor, measuring the user sto­ries the team completes during the sprint.

Lead indicators supposedly indicate how well an organization will likely per­form. However, our VUCA world can severely limit the usefulness of such in­di­ca­tors. We make decisions using lead indicators as input, then perform actions based on those decisions. So often, the volatility of circumstances and the un­cer­tainty of the lead indicators make those indicators less useful than desired. Lead indicators offer no guidance in ad­dres­sing those unexpected changes that occur while the work is being done.

Lag Indicators

lag indicator
Fig. 2: The lag indicator is measured after one or more process instances and applied to one or more future process instances

Wer nicht von dreitausend Jahren
Sich weiß Rechenschaft zu geben,
Bleib im Dunkeln unerfahren,
Mag von Tag zu Tage leben.
He who cannot draw on three thousand years is living in the dark from hand to mouth.
-Johann Wolfgang von Goethe

Lag indicators have the accuracy of 20-20 hindsight. Well, they do if the data se­lec­tion is not too biased. And the cal­cu­la­tion al­­go­­rithm must be correct. And that algorithm must be applied cor­rect­ly. And the indicator should be part of a ba­lanced decision-making system.

As systems become more complex, con­se­quently, deciders find it more difficult to predict the results  of any change. Lag in­di­ca­tors re­in­force the il­lu­sion that a change in the recent past causes the current state of a system. Such illusions may lead to Bermuda triangle-type phenomena.

The idea that the future is unpredictable is un­der­mined every day by the ease with which the past is explained.
-Daniel Kahnemann

Lag indicators might be useful if teams exploit them in a PDCA-style im­prove­ment cycle:

  1. They do some work
  2. They measure what they have done (i.e., they measure lag indicators)
  3. They make some changes
  4. Return to step 1.

For some, improvers are always at least one cycle behind when they choose im­prove­ments based on lag indicators. If the work done in step 1 (above) has unsatisfactory results, lag indicators  come too late to prevent the problem in the current process cycle. Using lag indicators to make decisions about the next cycle of work faces the same VUCA issues as lead indicators. Such use of indicators reminds us of the phenomenon of the general always fighting the last war.

Often, a lag indicator aggregates multiple measurements of multiple cycles of work. Such aggregation increases even more the lag between the activities measured and the supposed improvements based on those measurements.

Along Indicators

while indicator
Fig. 3: The along indicator is measured while a process instance is being executed and applied to that same process instance

Carpe diem quam mi­ni­mum credula postero.
Seize today and put as little trust as you can in the morrow.
-Quintus Horatius Flaccus

So, the question is whether we can find indicators that help us make decisions while work is being done. Can we make a difference in performance of the current process cycle, given the current cir­cum­stances, not the predicted circumstances in the future? This is where the Kanban method shines.

Take the example of cycle time, a typical lag indicator. More often than not, we seek to reduce mean cycle time for a given type of work. Kanban provides us with visual in­di­ca­tors of the current conditions that slow cycle time:

  • blocked work items
  • large queues
  • bottlenecks

By themselves, such indicators do nothing to improve performance. Improvement might come when those indicators are input to a ca­dence of re­views, decisions and actions. Certain of these cadences are along cadences, whereas others are lag cadences.

The daily team meeting and any immediate follow-up actions ex­em­pli­fy the along ca­dence. They typically address the issue of blocked work items. Or certain bot­tle­necks might be ad­dressed by an im­me­di­ate re-ba­lanc­ing of how the team uses its resources.

But suppose you need to address a bottleneck by changing a team’s quantity of resources or by chang­ing the value stream. In­di­ca­tors ag­gre­gated over time support such de­ci­sions. A monthly or even quar­ter­ly ca­dence of such de­ci­sions addresses these ag­gre­gated in­di­ca­tors. While “number of days blocked for a single work item” might be an along indicator, “mean number of days blocked during the past month for all work items” might be a lag indicator.

Note that aggregation does not, by itself, determine whether an indicator is lag or along. For example, traditional project ma­nage­ment mea­sures whether a single pro­ject is on time and with­in budget, both classic lag in­di­ca­tors. And both are mea­sured too late to make any dif­ference for the pro­ject con­cerned. They remain lag in­di­ca­tors when aggregated.

A matter of scope and timing

The astute reader will have noticed that along indicators are measured after one or more events occur, like lag indicators. Technically, this is true. The difference between a lag indicator and a alonge indicator lay in the granularity of the work we measure. A alonge indicator is use­ful only if the cycle time is significantly longer than the time to measure the indicator and react to the measurement.

Let’s return to the analogy I provided at the start of this article.

lead indicator cycle
Fig. 4: For lead indicators, the length of the cycle is not particularly relevant. The measurement and resulting action precedes the cycle start. The lapse of time between the action taken and the cycle start should be short.

Lead indicator: The scope of the indicator is too broad. It refers to your driving in general or to the entire trip. The indicator is not specifically tailored to the event of approaching a sharp bend in the road. Indeed, neither of you may have been thinking about the risk of unexpected sharp bends.

while indicator cycle
Fig. 5: For along indicators the time between the measurement and the action taken must be shorter than the remaining length of the cycle of work.

Along indicator: The indicator is tailored to the specific segment of the road on which you find yourself. It is communicated in such a way that the action to take is unmistakable and needs to be immediate.

lag indicator cycle
Fig. 6: If it takes longer to act on the measurement than the remaining duration of the work cycle, then the measurement cannot be an along indicator. It can only be a lag or lead indicator. Note that a lag indicator is typically measured after the end of the cycle, not during the cycle.

Lag indicator: Like the along indicator, it concerns only the immediate segment of the road. It might have some impact on the behavior of future drivers. But it comes too late the mitigate the current situation. Indeed, prudent drivers or slow drivers might end up completely ignoring the sign. If one day the driver is in a particular hurry, the sign might have no impact.

Three Indicators: Lead, Lag, Along

Management methods promoting agility encourage patterns of behavior enabling along in­di­ca­tors. These methods emphasize the value of adapting the gra­nu­la­rity of work items. When properly defined, a work item is suf­fi­cient­ly large to output some­thing useful to clients while keeping the administrative over­head low. It is suf­fi­cient­ly small to be measurable with along in­di­ca­tors and to allow for changes in direction with a minimum of lost effort. At the same time, whether the work item is completed successfully or not, it is of a size the encourages learning from work experience.

I hope this discussion encourages you to seek out along indicators and make the three indicators—lead, lag, along—part of your continual improvement efforts.

Creative Commons Attribution-NonCommercial-ShareAlike 4.0 International LicenseThe article The Three Indicators by Robert S. Falkowitz, including all its contents, is licensed under a Creative Commons Attribution-NonCommercial-ShareAlike 4.0 International License.

Credits

Unless otherwise indicated here, the diagrams are the work of the author.

Speedometer: By Bluescan sv.wiki – Own work, Public Domain, https://commons.wikimedia.org/w/index.php?curid=3457127

Figs. 1-3: The embedded image of the protractor is drawn from Scientif38 – Own work, CC0, https://commons.wikimedia.org/w/index.php?curid=12811448

Notes

1 In using the term “along” I attempt to preserve the alliteration of “lag” and “lead”. Terms like “while” and “during” are less happy. Other sources speak of “coincident indicators” (for example, https://www.investopedia.com/terms/c/coincidentindicator.asp). I hardly wish to give the impression that such indicators are coincidental.

Summary
The Three Indicators
Article Name
The Three Indicators
Description
When managing work in an agile manner, we should consider three types of indicators: lead, lag and along.
Author
Robert S. Falkowitz
Publisher Name
Concentirc Circle Consulting
Publisher Logo
Concentirc Circle Consulting

Filed Under: Continual improvement, Kanban Tagged With: along indicator, indicator, lag indicator, lead indicator

Subscribe to our mailing list

Click here to be the first to learn of our events and publications
  • Email
  • Facebook
  • LinkedIn
  • Phone
  • Twitter
  • xing
  • YouTube

Reader Interactions

Leave a Reply Cancel reply

Your email address will not be published. Required fields are marked *

This site uses Akismet to reduce spam. Learn how your comment data is processed.

Primary Sidebar

Kanban eLearning

Kanban training online

Recent Posts

  • The Three Indicators
  • Visualization of Configurations
  • How to increase visualization maturity

Tag Cloud

Cost of Delay change management agile problem cause priority value stream incident management tools ITSM lean management knowledge work manifesto bias ITIL incident flow efficiency risk Incident Management service request value automation agility impact rigidity kanban histogram waste service manager tools flow leadership lean knowledge management lead time kanban training process definition manifesto for software development process kanban board Service Management
  • Kanban eLearning
  • Services
  • Posts
  • Events
  • Publications
  • Subscribe
  • Rights & Duties
  • Personal Data

© 2014–2021 Concentric Circle Consulting · All Rights Reserved.
Concentric Circle Consulting Address
Log in