Are 80% of incidents really caused by changes?
In a recent thread, it was advanced that 80% of incidents were caused by changes. Since that figure does not correspond to any experience I have had with any organization, I thought it would be worthwhile to investigate a little how some organizations perceive the causes of the incidents that occur in their IT services.
The limits of Internet surveys
I am acutely, indeed painfully, aware of the limits of such investigations based on a survey advertised via a variety of LinkedIn and Facebook groups. The respondees are self-selecting and not random. The sample size is not very large. No matter how simple you try to make a survey, some of our dear IT brethren find the terminology too complex, hard to understand or poorly defined and they interpret the questions in different ways. The more you try to ensure accurate data with checks and controls, the fewer the responses are recorded. And most importantly of all, I doubt that most organizations really have the statistics to back up the values they report. Even though the survey is completely anonymous, there is a well known tendency for people to overestimate or be optimistic about what they do and know.
Therefore, the data reported here is most likely understood as the perceptions of socially engaged IT personnel willing to share some information. As such, it is no better nor worse than any other anecdotal information that makes its way into social media and tends to get repeated out of context and as if it were really true.
I note, too, that the free version of SurveyMonkey, used for this survey, has become largely useless for analyzing the collected data. I welcome suggestions from anyone regarding a viable alternative.
The design of the survey
The survey asked about the causes of IT incidents. Perhaps it should have talked of the causes of incidents in the services based on information technology, instead. At least one respondent thought that “users” could not cause “IT” incidents. Oh well.
It divided those causes into four categories:
- incidents caused by changes
- incidents caused by defects in components
- incidents caused by users
- other causes
With Einstein, I admit that this taxonomy might be too simple. I thought it to be is pretty orthogonal, but many respondees thought otherwise. Anyway, a change includes the introduction of new hardware or software or the reconfiguration of existing hardware or software. A component defect is, very simply, something that breaks, typically due to age or to patterns of use. Since most IT services are operated by end users, it should be clear that an operator can make a mistake and cause a failure. One respondent pointed out that some incidents might be due to inadequate capacity. To the extent that inadequate capacity is the result of implementing an incorrectly dimensioned system, I consider this to be a type of change. Capacity-related incidents may also be caused by changes in load patterns for which no corresponding changes in capacity have been made.
Analysis of the results
The survey was very simple, so the results can be displayed without graphs.
Number of responses:
61 (of whom 2 neglected to provide any data about the causes of incidents)
Complexity of organizations:
Simple: 3%
Medium: 22%
Complex: 75%
Size of IT staff:
<100: 16%
100-1000: 35%
>1000: 49%
Incidents caused by changes made by IT (including releases of software)
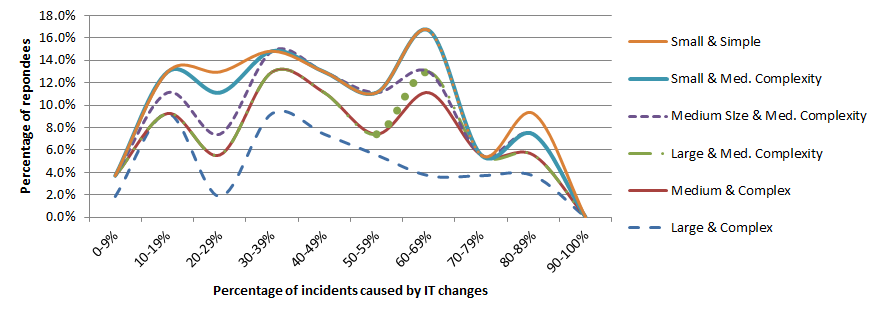
Fig. 1 shows the percentage of responses indicating that changes by IT are a cause of incidents, split out by both the size of the organization and its complexity. Not all combinations of size and complexity were recorded, as might be expected. There are two remarks to be made:
- Neither size of the organization nor complexity of IT appears to have a significant impact on the results.
- The four bumps in the graph, at 10-19%, 30-39%, 60-69% and 80-89% are not easily explained. Do they represent psychological phenomena? Are the respondees giving data based on reports from incident logs or are they provided seat of the pants impressions, not backed up by real data?
- Fewer than 10% of the respondees confirmed the initial report of changes being the cause of 80% of incidents.
Incidents caused by defective components
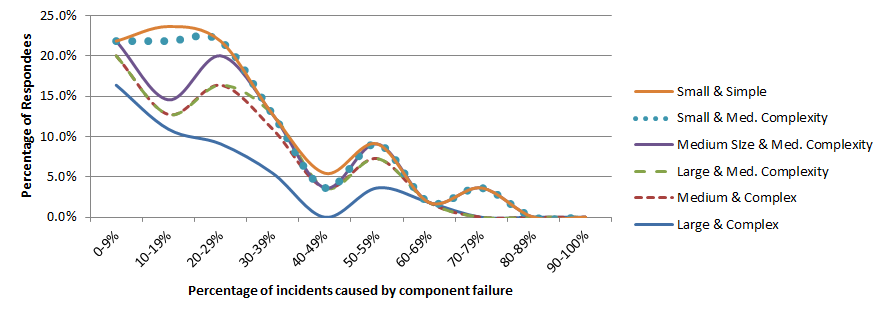
Once again, we see the strange bumps in the smoothed curve of the percentage of organizations reporting the prevalence of component failure as a cause of incidents. But the bumps are not exactly in the same places as for incidents caused by IT changes. There are many open questions, such as whether the respondees consider a component failure in a redundant system, where service continues, to be an incident or not.
Incidents caused by users

The respondees seemed somewhat reticent to blame incidents on users, albeit a few found them to be a very important cause. I assume that many of the respondees did not consider user support calls to the service desk as examples of incidents. Otherwise, we might have expected a very large number of user-caused incidents.
Other causes
No attempt is made to analyze other causes.
Synoptic view of all causes
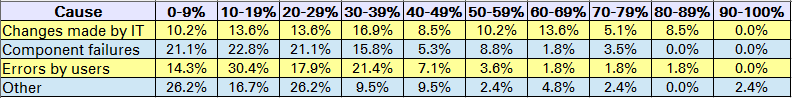
Fig. 4: Tabular analysis of causesAlthough a very few number of respondees clearly indicated that IT changes are the major cause of incidents, they were certainly in the minority. Although most respondees consider that the causes of incidents are multiple and spread out, the overall responses do show that IT changes are considered to be slightly more important as a cause of incidents than the other categories of causes.
Some of the reponses indicated a high percentage of incidents due to other causes. As we have not attempted to analyze what those other causes might be, we can only suppose that this represents a weakness in the survey itself as well as diverse understandings of the questions by the respondees. Indeed, we are obliged to take many of the responses with a grain a salt, given that the total percentages of all the causes were sometimes well under 100%.
 The diagrams in this posting are licensed to you under the terms of the Creative Commons Attribution-NonCommercial-ShareAlike 4.0 International license.
I felt that the survey was a good start to get people like us thinking realistically about the causes of incidents. I realise now that I classified incidents as “events that raise someone’s blood pressure”.
In my opinion users are very aware when IT makes a change, and IT is a sitting duck for blame. Users are not so aware of their own actions – I often tell a user “you must have pressed this key” but they insist they hadn’t!
I think you open the discussion, Seymour, to an issue that will become increasingly important as IT support becomes more social and the difference between user and supporter fades. Who, in the end, will be responsible for classifying the causes of incidents? Will it stay with the supporter, will it become subject to “Likes”, will the customer become the ultimate arbitrator? Does it make any difference? There will be many new challenges in our brave new world.
Could I use this graphs in scientific research, while quoting your website? Or quote a book about it?
The diagrams are licensed as per the Creative Commons Attribution-NonCommercial-ShareAlike 4.0 International license. See https://creativecommons.org/licenses/by-nc-sa/4.0/legalcode . I repeat the caution mentioned in the article that “the data reported here is most likely understood as the perceptions of socially engaged IT personnel willing to share some information”. In other words the data represent certain biases that further use should take into account.