The previous article in this series gave an overview of visualization types useful for managing services but rarely seen. In this article, I will examine in detail a key visualization, the value stream map (VSM). I do not intend to explain how to use VSMs. This article assumes a basic understanding of value streams and of value stream maps. Instead, I will examine how you might automatically create and update that visualization within service and operations management tools.1
What is a value stream map?
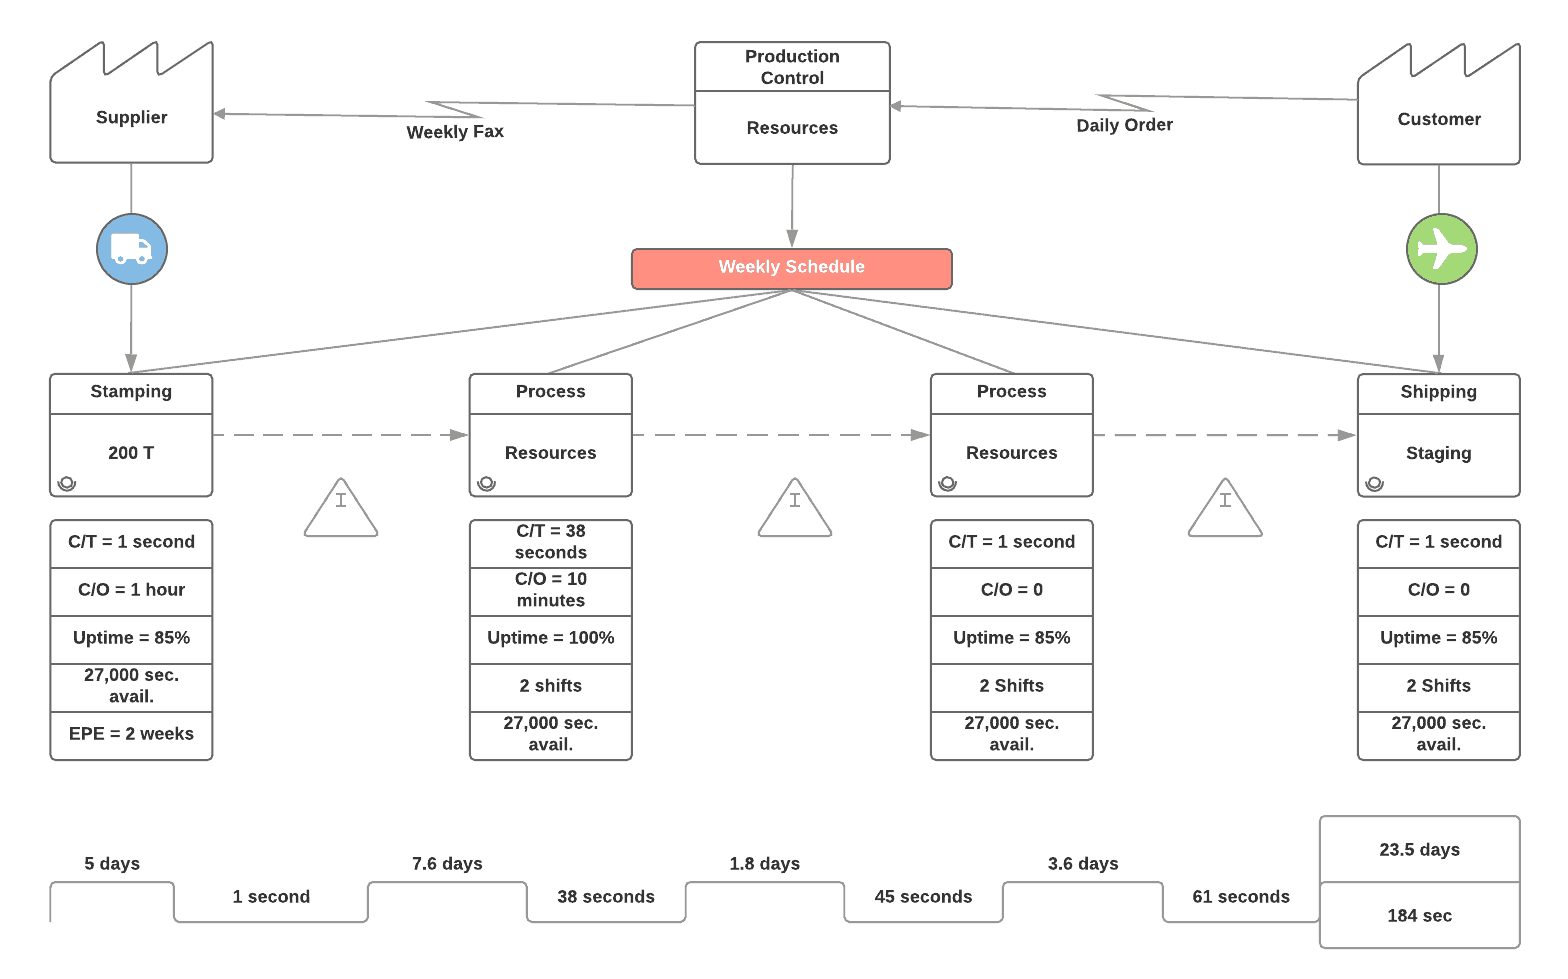
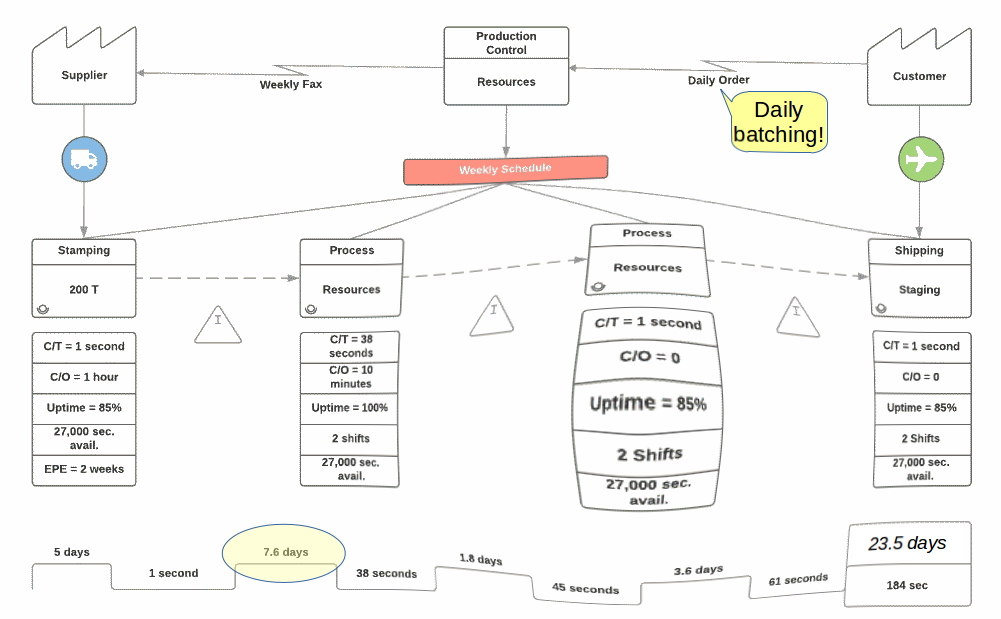
A value stream map is one of the key visualizations used in lean management. It describes the flow of information and materials through a value stream. Many readily available sources describe these maps, so I will not go into any detail here. I will only note the iterative use of the maps in value stream mapping. This activity supports the continual improvement of an organization. It especially concerns identifying waste in the flow of materials and information.
Tools for creating value stream maps manually
Many different tools are capable of creating value stream maps. Virtually all these tools provide a VSM template, icons and drawing tools to enter text, position icons and draw connections.
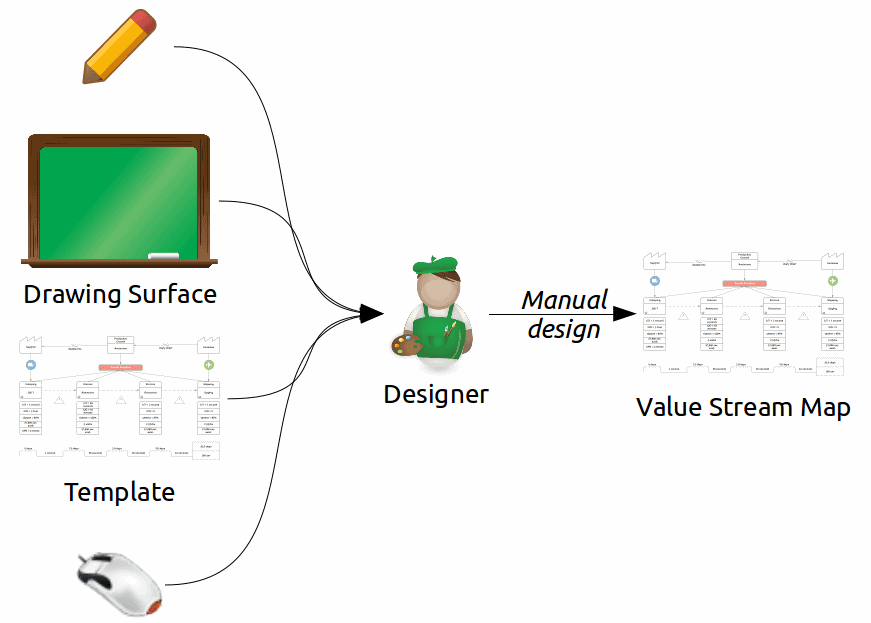
I might mention in passing the simplest of tools: pencil, eraser and paper or whiteboard, marker and eraser. Using these tools, especially in a group activity, allows for personal interactions like body language and tones of voice. Automated tools have no channels to communicate those interactions.
However useful such manually created diagrams might be, they have no built-in intelligence. They do not connect automatically to any underpinning data. Users may validate the accuracy of the diagram only manually. Their maintenance of the maps is labor-intensive. In short, such tools cannot create automated value stream maps.
Partially automated value stream maps
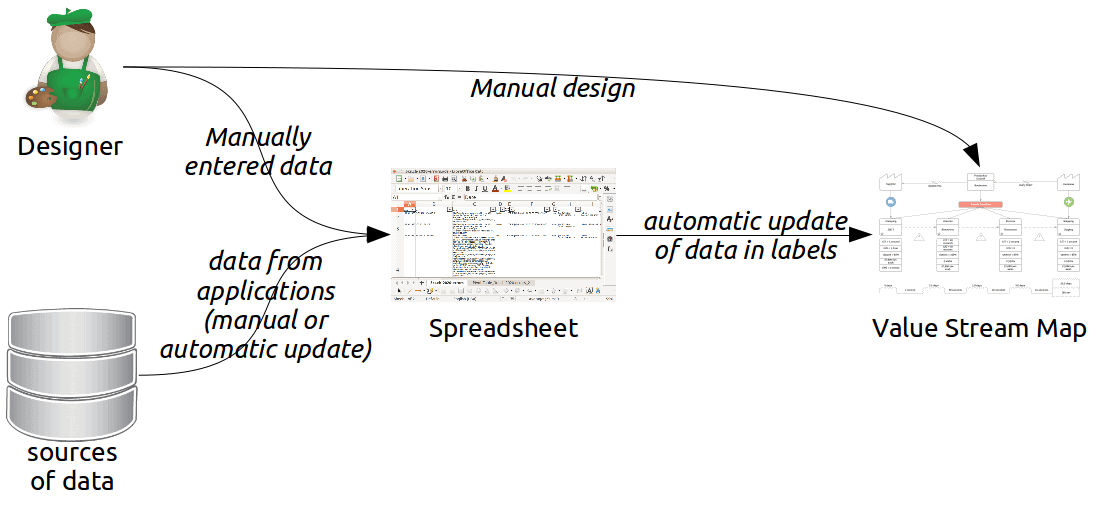
Certain tools go a step beyond this sort of simple drawing. They allow shapes in the VSM to be related to data in spreadsheets. As the data in spreadsheets changes, managers may need to alter the diagram. In some cases, this synchronization may be automated.
In their simplest form, such tools remain essentially drawing tools. The user must create manually the objects on the VSM. In the more sophisticated form, these tools can draw complete VSMs based on data in the spreadsheet. To my knowledge, such tools hard-code the style and layout of the resulting VSM. Such tools represent the simplest form of the automated value stream map.
Integrating VSM creation with service system management tools
The next step in the creation and maintenance of automated value stream maps would be to bypass the spreadsheets. Service management or operations management tools may directly provide the data to VSMs from the operational data they manage.
We may divide the setup of such automation into six areas:
- the design of a VSM template
- the definition of the value stream
- the identification of the data sources
- the linking of the data sources to the VSM object attributes
- the identification of thresholds to trigger alerts
- the definition of analyses of the VSM data
- the program for updating and communicating the VSMs
Once the designers complete this setup, the system may create VSMs in a largely automated way. As we will see, we may also automate some of the uses of VSMS, once delivered to the desired audience.
Design the VSM Template
A VSM template may define the default attributes for a VSM. These attributes might include the shapes and icons to use, the color palette, fonts and so forth. Technically, the template might take the form of an XSL style sheet applied to XML data.
The manual choices made by designers prevent the automation of template creation. Of course, some future and particularly sophisticated AI might be capable of executing this task.
Define the Value Stream
Value stream managers may define the value stream in a map either visually or by direct coding. Designers already do such work using business process automation tools or BPMN notation. They might find it easier to define the value stream phases and other VSM components using a visual tool. Theoretically, designers could directly write, or tune, the underpinning XML code. We might dub this technique “value stream as code”, analogous to “infrastructure as code”.
Lean management calls for gemba walks at the workplace to identify the phases of the value stream used in practice. How shall we conceive of a gemba walk when an IT system performs the service or process?
Certain tools can sniff network packets and trace other system artifacts. They add the intelligence needed to the flow of these virtual materials. Using such tools, it might be possible to identify flow based on the reality of how the service system processes information. If possible, we should prefer this approach to basing the value stream on the theoretical architectural designs of a service.
For example, an electronic mail delivery service has unique identifiers of messages allowing tracing the real processing of messages. We could apply a similar approach to other services if they had the necessary identifiers. There might be other methods to identify automatically how a system processes data.
Among the factors influencing the usability of such methods are:
- the degree to which nodes are shared
- the complexity of the processing
- the design of the information packet
- the technologies in use
Automating the identification of the value stream phases might be possible if the service system were designed to allow the necessary tracing.2
Identify the Data Sources
Data maintained in automated management tools may supply most of the object attributes displayed on a VSM. I note below the exceptions depending on manual updates.
You will see in the diagrams below that I suggest automated updates based on data in log files. In principle, those data represent the reality of what happens in a service system. This reality may well be different from what we find in normative configuration records, agreements and other such sources.
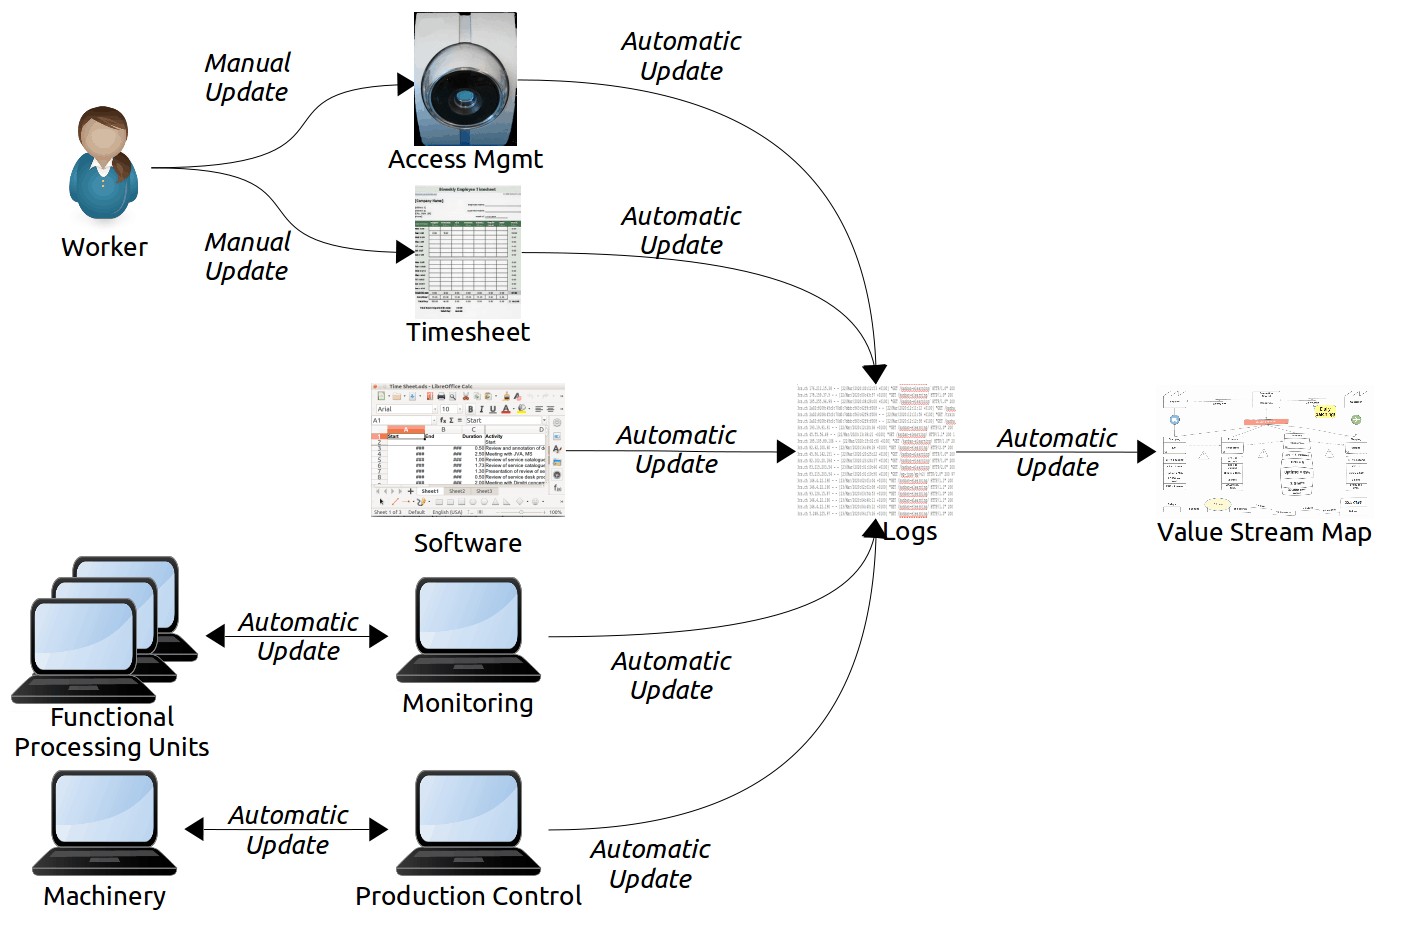
Cycle Times
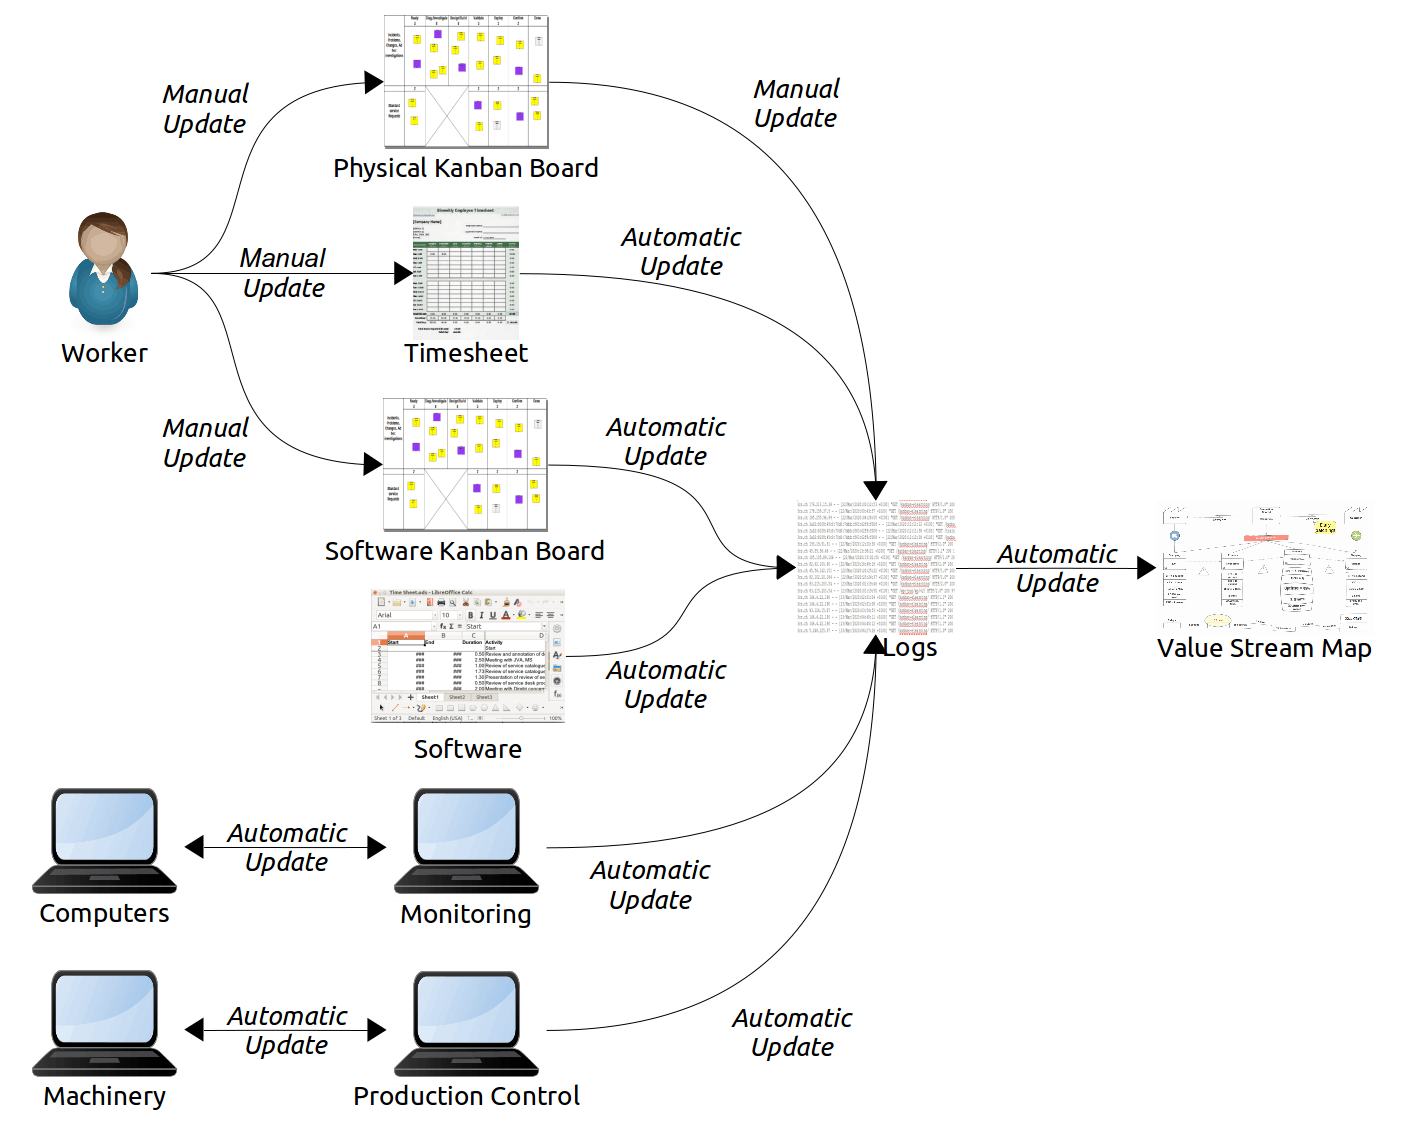
Cycle times may be measured and reported using various sources. Computer inputs and outputs might be timestamped. Kanban boards, whether physical or virtual, might record start and end times. Executors of purely manual tasks might report their cycle times.
In some cases, designers might calculate mean cycle times using Little’s Law:
Mean Lead Time = Mean work items in progress / Mean work items per unit time
Make sure that the measured times do not include non-value-adding time.
When machines perform work, we can distinguish between value-adding time and non-value-adding time in a straight-forward way. When people perform work, only the executor of the task can really distinguish what was value-adding from what was not. Consider the issues associated with completing a weekly timesheet, recording the amount of work done on each assigned project.
Who knows what percentage of the time spent on a single task was value-adding? In general, only the person performing a task knows that. Note that the mere fact of recording such information is, itself, non-value-adding. Furthermore, worker biases and other forms of error depreciate the reliability of such time estimates. Consequently, you may wish to collect these data only periodically, not continuously. Too, independent controls on the data recorded could help reduce bias and improve accuracy.
Take care to avoid high levels of measurement overhead. Random sampling may help to reduce that overhead, especially for a high volume of work items during the measurement period.
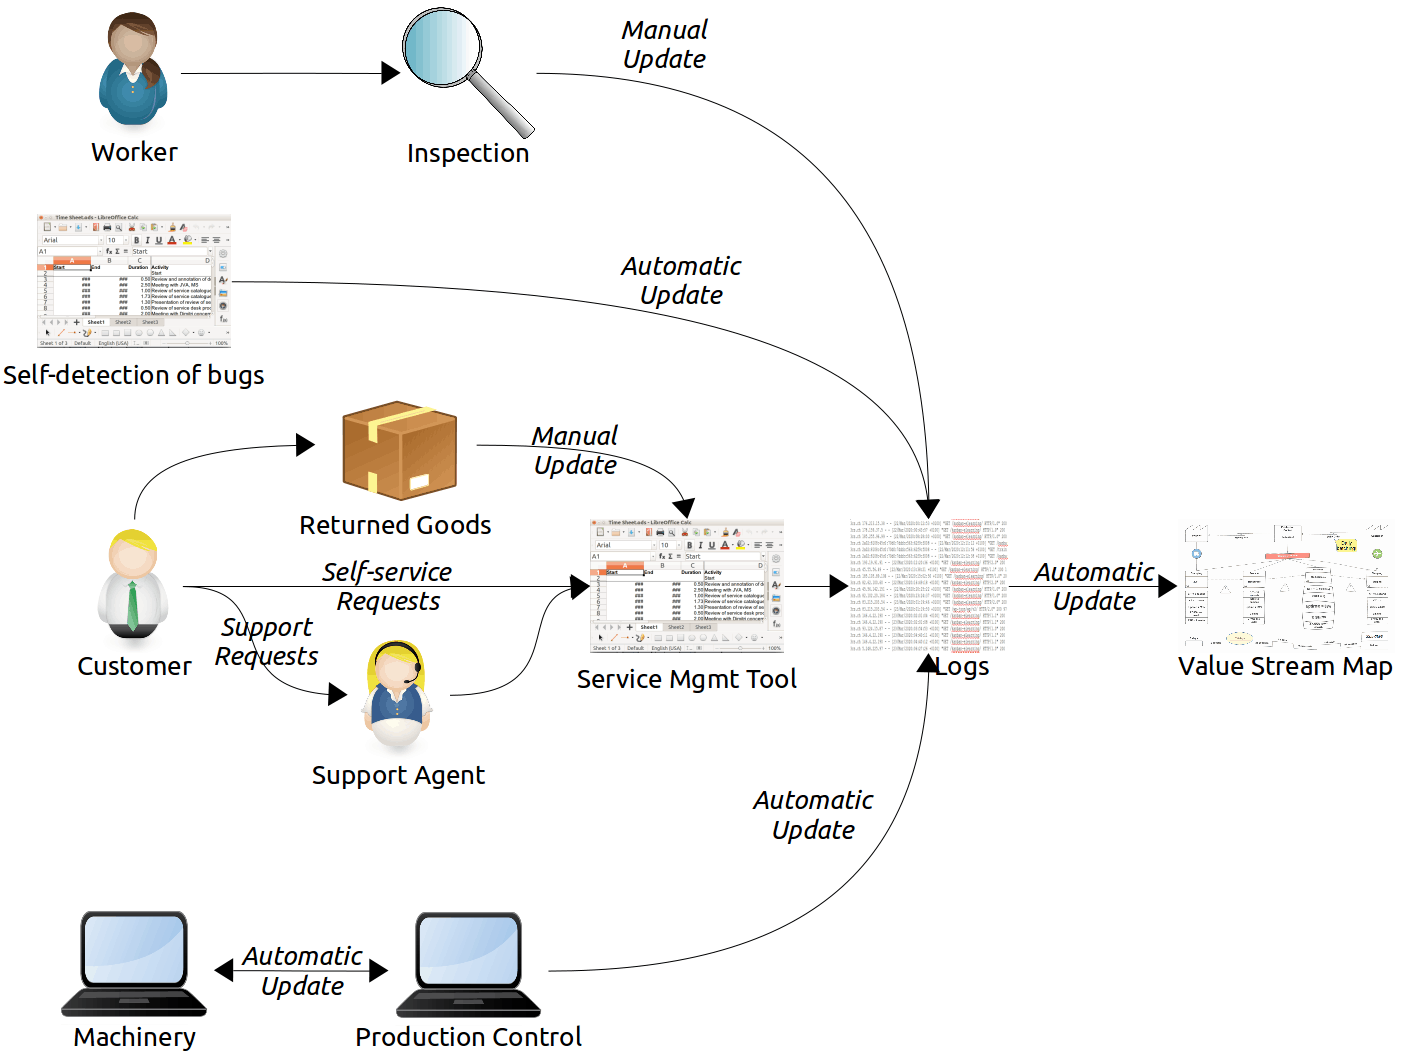
Queue/Inventory Sizes
A value stream map should report aggregated values of queue size. Instantaneous measurements of queue size support proactive allocation of resources and unblocking activities. However, they do not support optimization activities based on value stream maps. Instead, we seek such statistics as mean inventory size and standard deviation over the sample period.
If computerized agents perform services, monitoring agents can measure queue sizes. For example, a message transfer agent (MTA) will have an input and an output queue. Standard agents can measure the size of those queues and report those data to the event management system.
For manual work, designers may derive queue sizes from kanban boards. The board designer may split each value stream phase into an “in progress” sub-column and a “completed” sub-column. In that case, the queue sizes may be viewed directly from the “completed” sub-columns. Otherwise, the “Ready” or “Backlog” columns to the left side of kanban boards display such work. Portfolio kanban software would be particularly useful for gathering such data. Furthermore, it can help ensure the same data are not counted multiple times.
For physical materials, the machines that automate the handling of materials may provide inventory sizes. Supply chain data may also provide the data needed for their calculation.
In an information technology context, inventories of goods might include computers, spare parts and other devices. These components may be in storage, awaiting use or in the intermediate phases of a value stream. For example, a technician may clone a batch of disks to prepare computers for deployment to the desktop. After preparation, but before installation in the computers, they form part of an intermediate inventory.
The diagram for cycle times (Fig. 4) is also mostly relevant to capturing queue sizes.
Availability
In an automated value stream map, we should consider the availability of the whole system required for each value stream phase. Drilling down to the individual components becomes important only to define specific actions to improve availability.
Analysts may measure the availability of computing devices and other machinery in many ways. For value stream mapping, the most appropriate way is to subtract the downtime due to incidents from the planned service time, divided by the planned service time. However, I would not generalize the use of this metric for availability.3
The service management tool should understand the relationship of system components to the successful completion of each phase of the value stream. Incident tracking needs to be able to identify when any of those components have failed. It further needs to relate those failures to the components. In this way, the service management tool can automatically calculate availability for the value stream maps.
Resource and Capacity Use
Defect Rates
- each phase has distinct criteria for successful completion
- these criteria are tested at handover time to the next phase
- the results of such tests—at least, the negative results—are logged
Batch Sizes
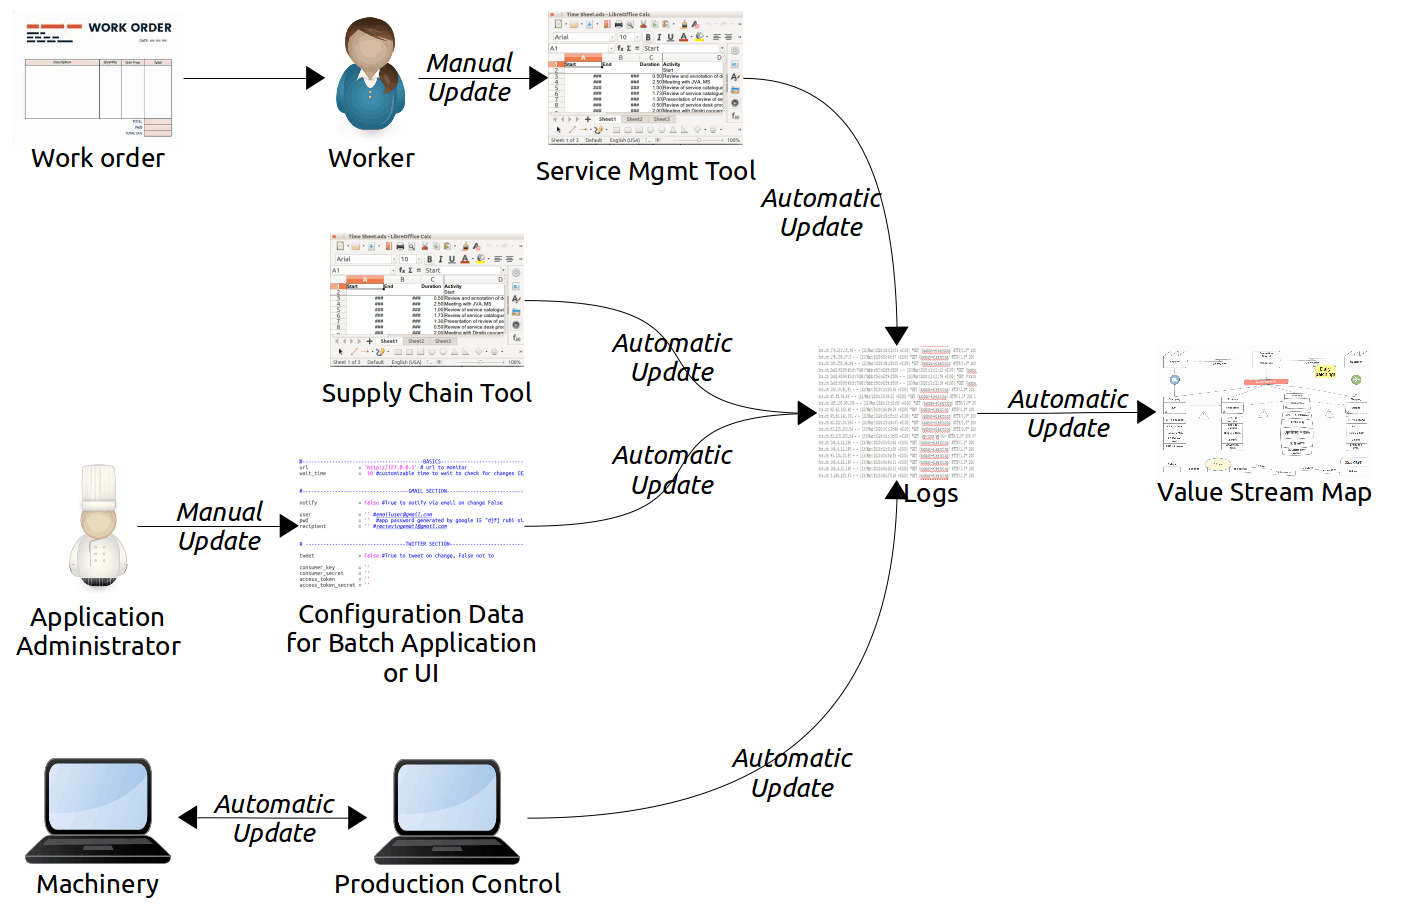
The size of a batch of work can have a very significant effect on the flow of that work. Consequently, it can have a significant impact on throughput and lead times. Despite this impact, service management tools do not generally provide a structured way of defining and managing batch sizes. Therefore, it might be difficult to automate the reporting of batch sizes in a VSM.
In a retail store, batch size might be the quantity of items ordered from a distributor when it is time to restock. In a factory, batch size might be the number of components to assemble when it is time to fetch more to a station on that line. But what do we mean by “batch size” in the context of services delivered via software applications?
Software applications might manage the flow and processing of information in batches, as distinct from handling every transaction separately. The daily accounts closing aggregating the day’s transactions and balances exemplifies this. Responding to queries in blocks of data, rather than delivering all results at once, is another example. Thus, you might see the results of a query in, say, 25 lines at a time. If you want to see more, click on the “See more” button.
Batching of work also occurs in the management of technology components. For example, when a user in your company needs a new computer, do you prepare just a single computer and deliver it or do you prepare a batch of computers? Technicians use the logic that larger batches of computers prepared in advance permit more rapid deliveries. Of course, doing such work in batches may also lead to various forms of waste, such as overproduction and rework.
Therefore, there is a case for knowing and reporting the sizes of batches. Tuning batch size is part of the incremental changes you might make to optimize the flow of work.
Data about the sizes of batches might hide in various places in management tools. Work orders instructing someone to prepare x number of components might contain batch sizes. Application configuration files or database records might contain them. Or they might be implicit in the capacity of the infrastructure used.
For example, the size of a batch of goods delivered by truck might be “as many as can fit”. The number of new disks in a batch might be “the number of connections to the ghosting apparatus”. Remember, though. A gemba walk might reveal actual batch sizes that differ from the planned or theoretically sizes.
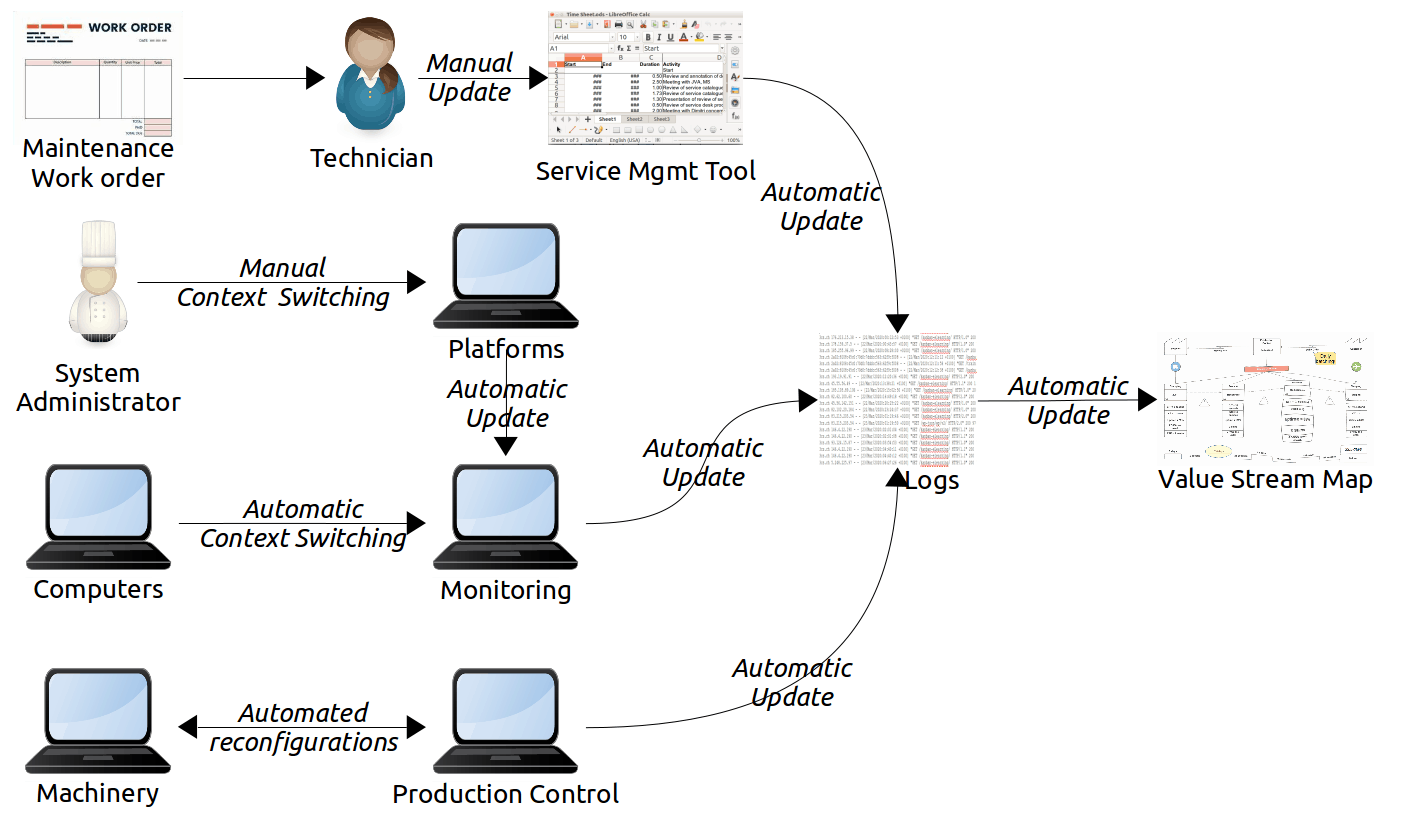
Changeover and Maintenance Times
Changeover times might have a high impact on the flow of work on assembly lines. However, software systems, by their very nature, do not have such issues. Or, at least, they perform changeovers rapidly. The waste of such changeovers may become noticeable only when value stream managers eliminate far more important sources of waste.
We may consider two types of software changeovers. First, system managers might stop some software running on a platform to free up resources for a different software. Shutting down a virtual machine and starting up another virtual machine on the same platform exemplifies this need. Another example is shutting down one application followed by starting up another application.
The second case is typical of any operating system supporting pre-emptive multitasking. The processor cycles dedicated to process context switching are a form of changeover and waste. Monitoring the number of context switches, as opposed to their duration, might be is generally possible.
Whether a system is hardware or software, it may require shutdowns for maintenance purposes. Technicians often perform manual maintenance tasks according to work orders generated by the production control system. However, derive data for the VSMs from the aggregate of the actual maintenance times. We prefer this to the expected times that work orders might indicate. Log and report automated maintenance tasks (which are generally non-value-adding activities). Examples include the periodic rebooting of servers or the shutdown of applications during the reorganization of indexes.
Similarly, virtually all software batch operations are non-value-adding actions. Think of importing daily exchange rates, adding the day’s transactions to a data warehouse or the periodic closing of books. These are not forms of maintenance, however. Report these activities as phases of the value stream, especially if they are performed frequently.
Link the Data Sources to the VSM Objects
We have seen that a VSM may contain automatically reported data derived from various management tools. Some data, however, might be difficult to obtain automatically. Other data might reflect planned or expected values rather than the actual operational values.
The VSM designer must link the identified data sources to objects in the value stream map. For example, link each inventory shape to the calculation of its inventory size. Link mean cycle times to the segments in the VSM’s timeline, and so forth.
Identify Alert Thresholds and Algorithms
Define Visual Analytics
- special colors with the color scheme in use
- special fonts
- changes to backgrounds around the objects or the labels concerned
- text annotations
- fish-eye display of map objects worthy of closer attention
Update and Communicate the Automated Value Stream Maps
Validate and Decide
Implement Improvements
Summary of Benefits of Automated Value Stream Maps
Summary of Drawbacks of Automated Value Stream Maps
I have already alluded above to the benefit of creating a value stream map manually. The creators struggle together in finding the best ways to present the information on the map. They might decide to adapt the map for the particular purposes of a given service. In the end, they understand the details of the map because they created each part themselves. Merely being presented with an image created by a third party makes learning from the map harder.
I described above how an automated value stream map might include visual indicators of factors that lead to waste. While they enhance map usability, they also present the risk of ignoring factors that are not visually dominant. Compare this situation to the bias assuming all is well if the light on the control panel is green.
Setting up the automation of value stream map creation is itself a labor-intensive activity. It makes sense only if the resulting system will create value stream maps regularly. This would be the case if value stream maps were being used as intended. However, some immature organizations might think of value stream maps as one-off types of documentation. They might create them once and then file them. In such cases, automation makes little sense.
As with any form of automation, it makes sense if it solves one or more problems an organization is facing. But if the organization cannot identify the problems it is trying to solve, it cannot understand the value of automation. Such automation efforts are likely to be misguided and wasteful.
![]() The article Automated Value Stream Maps by Robert S. Falkowitz, including all its contents, is licensed under a Creative Commons Attribution-NonCommercial-ShareAlike 4.0 International License.
The article Automated Value Stream Maps by Robert S. Falkowitz, including all its contents, is licensed under a Creative Commons Attribution-NonCommercial-ShareAlike 4.0 International License.
Notes
1 This is not a tutorial on how to use any particular service management tool. To my knowledge, no service management tool currently has the capability to automatically create and maintain value stream maps. However, if users are aware of what is possible, without very much effort on the part of the tool designers, they might start to request such capabilities.
Credits
Unless otherwise indicated here, the diagrams are the work of the author.
Leave a Reply