In this installment of my series of articles on information visualization and service management, I will describe some of the features of the biology of vision. I provide this précis, not because it contributes anything to understanding the biology, but because it will help understand certain issues in designing visualizations that I will address in other articles.
Steps in perceiving a visualization
1. Light arrives from the visualization
A visualization either emits and/or reflects light of various wavelengths. In the latter case, the pigments in the visualization combined with the wavelengths and angles of the light illuminating it determine the wavelengths of the light arriving at the eye.
For all practical purposes, the transmission of light until it hits the retina is instantaneous.
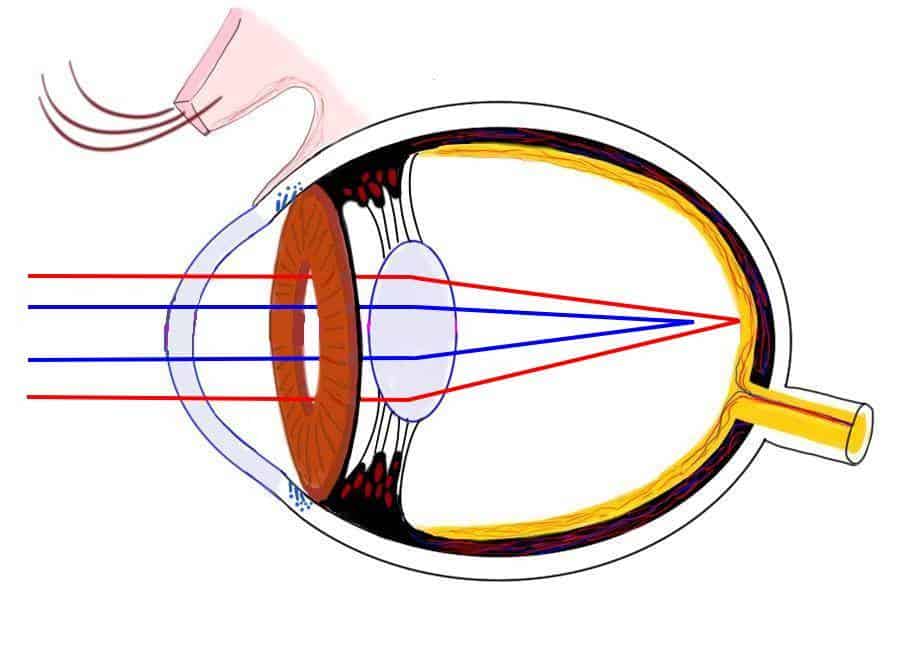
2. Light passes through the lens of the eye
Unlike the color-correcting lenses in modern photographic equipment, the lens in the eye refracts different colors at different angles. As a result, the focal points of different colors might be far enough apart that the viewer has difficulty in focusing on each of those colors at the same time. As information visualizations are normally in a single plane, this can make the visualization difficult to see with good acuity, especially for short wavelength colors like blue.
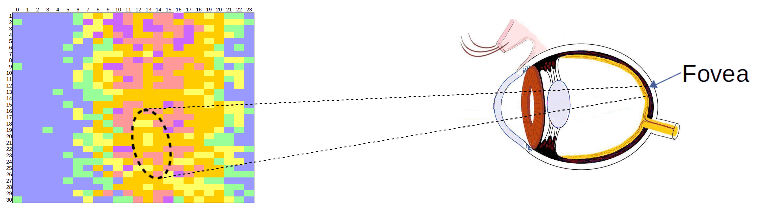
3. Light hits the retina
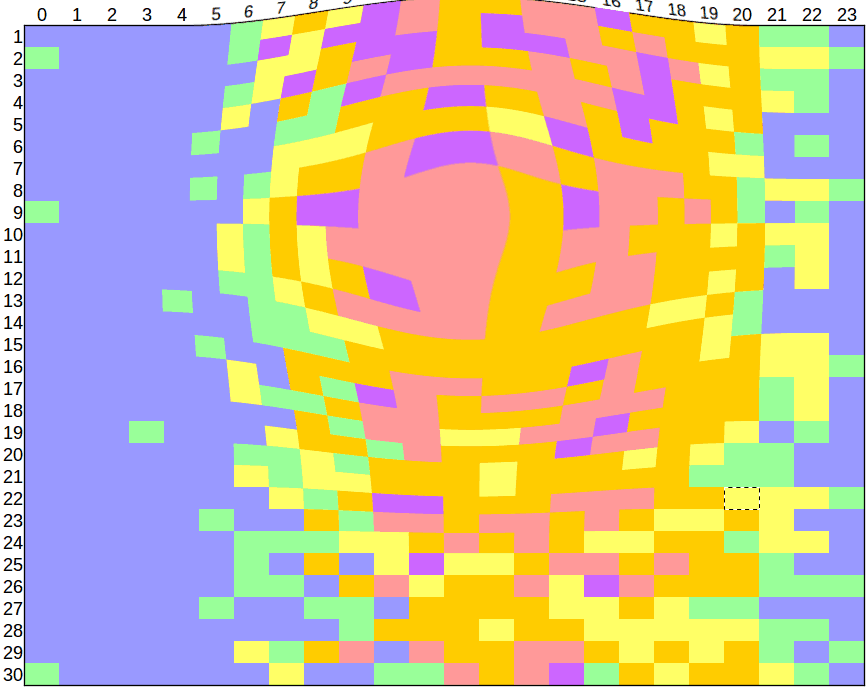
The light arrives at the retina where it stimulates the rods and cones. They convert the light to electrical signals in a process called transduction. In low level light only the rods are stimulated, meaning the perceived image will be in shades of grey. In higher light levels, the cones are stimulated. These cones are not equally distributed on the retina. They are much denser at a point called the fovea. This means that colors corresponding to the angle of vision landing at the fovea are best perceived (Fig. 3). This impacts, in turn, the relative size of a visualization and the placement of objects within the visualization.
The impact of defective cones will be discussed further below.
4. Signals enter the visual image store
The eye can store the equivalent of roughly 7 to 17 letters in what is called the visual image store. The data in that store decays at a rate of somewhere from 90 to 1000 ms.
5. Perceptual processor
Initial processing of the image signals is performed by what is called the perceptual processor. The cycle time for the processor is 50 to 200 ms. The processor starts the process of interpreting the electrical signals. It does such things as recognize edges, some shapes, movement, focus attention, etc. In case you think you see a tiger in the bush, that helps you to get the hell out of there quickly (but don’t do that if its a bear).
6. Working memory
The signals enter a very short-term working memory. The capacity of this memory is about 5 to 9 chunks of information, as processed by the perceptual processor. A “chunk” is a variable concept, depending on the details of what is seen. It could be a bar in a bar chart, a label, a word, a single letter, and so forth. The size of this memory accounts for the fact that people can typically recall up to about 7 objects if an image of many objects is flashed before them. The data in the working memory decay in 5 to 226 ms.
7. Cognitive processor
The cognitive processor is the part of the brain that interprets the signals coming from the working memory. This is the part of the process where you recognize what you have seen. For example, the brain might identify the image as being a bar chart. This takes 25 to 170 ms.
Various rapid responses may be triggered based on what has been detected. These responses do not normally concern information visualizations. Instead, they concern such issues as whether you should run away from the tiger you think you see, or issues of hand-eye coordination.
Further cognitive processing, involving other parts of the brain, analyze the components in the visualization. At this point, the message of the information visualization is identified and further “slow” reactions, such as the decisions of what to do based on the visualization, are executed.
8. Long-term memory
Aspects of the visualization are stored in long-term memory. This memory can be very large and the decay rate of memories very slow. From our perspective, the importance of long-term memory is for the cognitive processing of the visualization. As we shall see in another article, it is very helpful if the viewer can identify a visualization as a type of image already seen: “Oh! That’s an X-Y plot with a logarithmic scale. I’ve seen such plots before and understand how to interpret them.”
How long it takes to perceive
From the above discussion, we see that it takes a certain amount of time to perceive an image, before the higher level cognitive functions of the brain start to interpret what has been perceived. There is also a short persistence of an image, somewhere between touch and hearing. Do you retain the feeling of a texture beyond the moment of touch itself? Hearing, on the other hand, can persist several seconds. The persistence of vision is somewhere between the two.
This persistence accounts for how we perceive motion and the illusion of cinematography. In information visualizations, persistence may impact our decisions regarding the animation of objects, how frequently positions should be updated and the number of animated components.
Vision pathologies
Different people see differently. When your vision does not resemble the dominant patterns, society deems you to have defective vision. If the creator of an information visualization ignores these other ways of seeing (or not seeing at all), there is a risk that the recipients of the visualization will not understand its message. If such communication failures are unacceptable to you, then you need to be aware of the differences in vision that might occur.
I have three reasons to reject the notion that such variants in vision are truly defects or pathological. First, many people lead rich and useful lives often not being aware of their so-called defects. Second, the dominant standards cannot be understood as a form of perfection. Falcons see better than people, just as dogs have a better sense of smell. 20/20 vision is not perfect vision; some people have 20/15 vision, for example, yet 20/20 vision is not considered to be a defect. Third, some variants are improvements, not defects. A very interesting case of achromatopsia discussed by Oliver Sacks in The Island of the Colorblind tells of people who cannot see colors but have heightened sensitivity to shades of gray, as compared to people who can see colors.
Blindness
It is very difficult to define blindness, given that situations may range from no perception of light at all through perception of light but the inability to distinguish objects to the partial inability to distinguish objects. Without worrying about a precise definition, we might identify the prevalence of blindness ranging from about .5% of the population at birth to about 20% of the population in old age. This means that there are likely to be blind people among the audience targeted by your information visualizations.
It may be difficult to replace the very high density of information that is possible with visualizations. However, a very large number of visualizations could readily be replaced by touch. I am sure that the technology exists to translated many visualizations into objects whose components could be distinguished by the feel of bumps, as in Braille (Fig. 4), or via different textures.
Imagine, for example, a Venn diagram where each region is represented by textures more or less rough (Fig. 5). Think of the ease with which we can distinguish the thickness of one sheet of paper from two sheets of paper. The acuity of touch is largely unexploited.

Color Blindness
A variety of different conditions have been identified as forms of color blindness. They range from difficulty in distinguishing two specific colors, such as red and green, to the inability to distinguish any colors at all (achromatopsia). These conditions are usually due to the misfunctions of the retinal cones, although they might also be due to other problems downstream from the retina. The physiological cause is not directly important for information visualization.
The most common forms of color blindness are genetically determined and affect mostly people with XY chromosomes. Approximately 10% of that population can be said to be color blind; a much smaller percentage of the population with XX chromosomes is also color blind. I do not have statistics on color blindness for people with other chromosomal configurations. In any case, you are very likely to have some color blind people among your visualization audience.
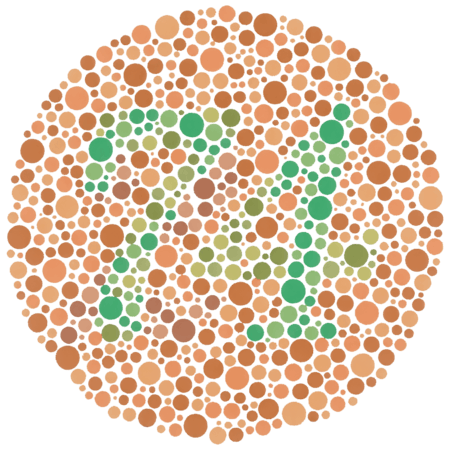
I was diagnosed as being “color blind” in my late 20s, before which I was not aware at all of having that condition. For me, the difference between the red and the green traffic lights was obvious. I never seemed to have any practical issues with colors. Perhaps this was because I never paid close attention to colors. In fact, I often face the problem of viewing charts where data series are distinguished by colors and I am unable to relate the color of a line or a glyph to the corresponding color in the key. Many color blind people have similar issues.
There are about nine different identified “anomalies” in seeing color. For the creator of an information visualization, the etiology of color blindness is of little importance. Instead, it is important to know the patterns of confusion of colors. Essentially, there is red-green color blindness, blue-yellow color blindness and total color blindness (no perception of colors). I will return to this question in a future article where I will discuss the use of color in visualizations.
Other vision conditions
Since vision depends on a complicated system, many conditions may deviate from the average. Many of them, such as glaucoma, retinopathy, macular degeneration or even cataracts may be assimilated to blindness, when considered from the perspective of information visualizations.
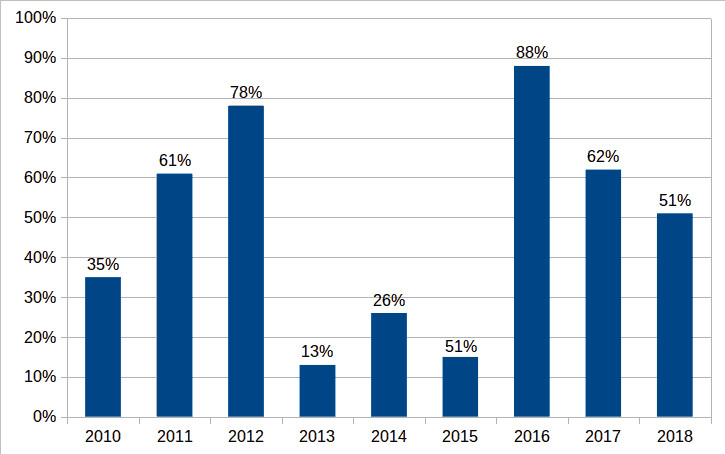
Other conditions, such as dyslexia, are found in a large segment of the general population. Are you surprised that the overall occurrence of dyslexia is around 15%? This condition especially concerns the labels and other text on information visualizations. Imagine that you have labeled a data point as 15%, but a dyslexic person sees it as 51%. Fortunately, visualizations provide cues that help the dyslexic to identify such confusion. When you see that a bar takes up only 15% of the vertical space of a diagram, but you perceive the label as saying 51%, you have a strong hint that there might be an error in your perception (Fig. 7).
Otherwise, various vision support tools, such as fish-eye magnifiers (Fig. 8), are useful not only as a means to see details within context but also to help people with special vision conditions.
It remains to be determined if there are specific conditions related to data or information visualizations. Is it possible that some people might see the bars of a bar chart in a different order, much as a dyslexic person might see the letters of a word in a different order? As it happens, many people fail to receive the messages of information visualization. This might be due to poorly conceived visualizations, or a lack of familiarity with the visualization type, or a lack of interest or even insufficient cognition. But is it also possible that there are hitherto unidentified perceptual conditions?
Summary
By understanding something of how we see—or not see—we can adjust our visualizations to help them communicate our messages better. In particular, understanding the biology can help us to optimize a visualization’s:
- size
- the number of objects it displays
- the placement of those objects
- animation of objects
- colors and other visual attributes
I will discuss many of these issues in future articles.
![]() The article Information Visualization and Biology by Robert S. Falkowitz, including all its contents, is licensed under a Creative Commons Attribution-NonCommercial-ShareAlike 4.0 International License.
The article Information Visualization and Biology by Robert S. Falkowitz, including all its contents, is licensed under a Creative Commons Attribution-NonCommercial-ShareAlike 4.0 International License.
Credits
Unless otherwise indicated here, the diagrams are the work of the author.
Figs. 1, 2 and 3 include a diagram of the eye by Chris Sullivan – Own work, CC BY-SA 4.0, https://commons.wikimedia.org/w/index.php?curid=83021308.
Fig. 3 is very widely reproduced diagram in the public domain originally designed by Shinobu Ishihara.
[…] lens in the eye refracts different colors differently (see my article on the biology of visualization). As a result, the focal points of different colors might be far enough apart that it is difficult […]