
I went to the supermarket yesterday and was delighted to see a standard kanban practice was implemented there. Attempting to limit the density of the shoppers in the store, you had to wait at the entry for a card—in fact, a kanban card—before entering. At the exit, you returned the card, enabling another entry to […]
Posts
Visualizing uncertainty
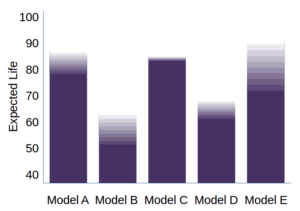
In this age of visual management, Bayesian reasoning, machine learning and other statistical methods, it is increasingly important to understand how certain we are about the “facts” and how to visualize that uncertainty.
Why Use Information Visualizations?
Visualizations are but one channel among many for communicating messages. What are its particular advantages? In addition to describing many of the benefits of information visualizations, I end this article with a few caveats regarding their difficulties or misuse.
Information Visualization Glossary
A glossary of information visualization terms as used in this series of articles
Information Visualization and Color

In the early days of digital computing and personal computing, our tools were largely monotone: screens with green or orange characters against a black field and dot-matrix printers whose ribbons had but a single color. As color screens and printers became common, so did the color capabilities of the software applications we use. I think […]
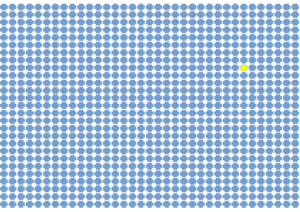
Information Visualization and Biology
Some information about how we see, or how we do not see, is useful to understand various techniques used on creating information visualizations.
Information Visualization or Data Visualization?
It is useful to distinguish between “data visualizations” and “information visualizations”. How do they differ and how can this distinction help us make more effective visualizations?
Demand Management: Chimæra, Selkie or Sphinx?
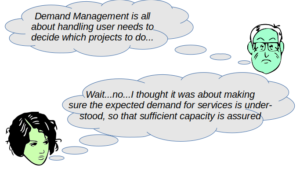
What is demand management? Sometimes it seems like a chimæra, other times like a selkie and yet other times like a sphinx.