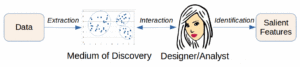
It is useful to distinguish between “data visualizations” and “information visualizations”. How do they differ and how can this distinction help us make more effective visualizations?
Visualization
Information Visualization and Biology
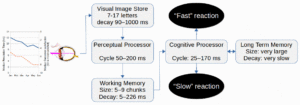
Some information about how we see, or how we do not see, is useful to understand various techniques used on creating information visualizations.
Information Visualization and Color

In the early days of digital computing and personal computing, our tools were largely monotone: screens with green or orange characters against a black field and dot-matrix printers whose ribbons had but a single color. As color screens and printers became common, so did the color capabilities of the software applications we use. I think […]
Information Visualization Glossary
A glossary of information visualization terms as used in this series of articles
Why Use Information Visualizations?
Visualizations are but one channel among many for communicating messages. What are its particular advantages? In addition to describing many of the benefits of information visualizations, I end this article with a few caveats regarding their difficulties or misuse.
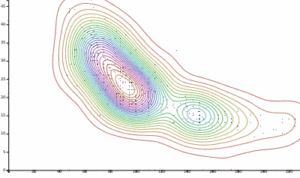
Visualizing uncertainty
In this age of visual management, Bayesian reasoning, machine learning and other statistical methods, it is increasingly important to understand how certain we are about the “facts” and how to visualize that uncertainty.
Information Visualizations for Service Management
Service management tools include only rarely the visualizations that provide a high level of information to support the management of services. The reasons for this and many examples of high-level visualizations are provided.
Principles for Automating Value Stream Maps

An automated value stream map is an advanced example of how information visualizations may be integrated into service system management tools.